Average Days Delinquent (ADD) Explained
Learn what Average Days Delinquent (ADD) is, how to calculate it, and how to use it alongside DSO and past-due percentage in AR reporting.
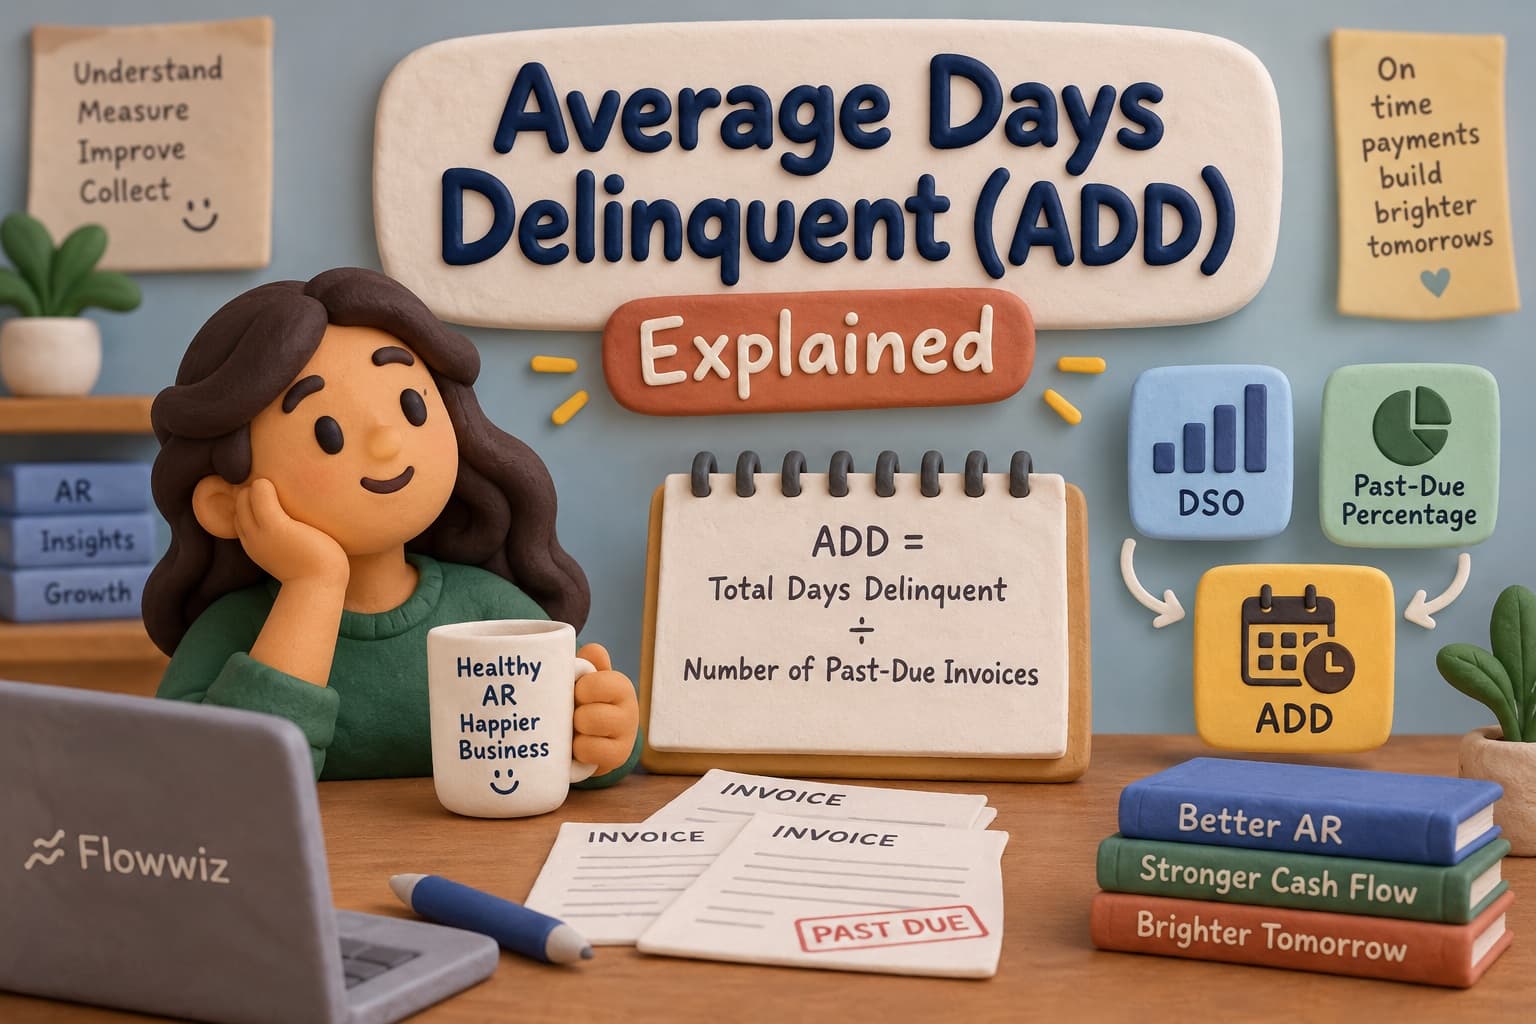
Learn what Average Days Delinquent is, how it's calculated, and why it should never be read on its own.
Your DSO went up 6 days this quarter. Is that a collections problem, a sales problem, or just noise?
DSO alone can't answer that. It blends every open invoice, current and past due, into one number.
Average Days Delinquent (ADD) is built to isolate the part DSO can't: the gap between how long receivables are actually taking and how long they'd take if every customer paid on time.
Start with the two numbers ADD is built from
ADD isn't a new balance to pull from the ledger. It's the difference between two DSO-style calculations you may already have.
DSO: the broad view
DSO = Ending Accounts Receivable × Number of Days ÷ Credit Sales
DSO uses the full ending accounts receivable balance, current invoices and past-due invoices together.
Best Possible DSO: the best case
Best Possible DSO = Current Receivables × Number of Days ÷ Credit Sales
Best Possible DSO uses only the receivables that aren't yet past due. It's the DSO you'd report if every open invoice were still within terms.
The ADD formula
ADD = DSO − Best Possible DSO
That's it. ADD is the number of days of "extra" DSO that delinquency alone is responsible for.
A worked example
Say an AR Manager is closing out a 90-day quarter:
Input | Value |
|---|---|
| Ending Accounts Receivable | $1,200,000 |
| Current Receivables | $750,000 |
| Credit Sales | $2,400,000 |
| Number of Days | 90 |
DSO = $1,200,000 × 90 ÷ $2,400,000 = 45 days
Best Possible DSO = $750,000 × 90 ÷ $2,400,000 = 28.1 days
ADD = 45 − 28.1 = 16.9 days
Of the 45 days of DSO this company is carrying, 16.9 days are attributable specifically to invoices that are past due, not to the underlying payment terms or sales volume.
What ADD does and doesn't tell you
ADD tells you the size of the delinquency gap. It doesn't tell you why it exists.
A rising ADD could mean:
- A handful of large accounts have gone past due
- More customers are disputing invoices
- Payments have been received but not yet applied
- Payment terms or the customer mix changed
- The revenue side of the formula shifted, not just collections
That's why NACM recommends never treating ADD as a standalone verdict on collections performance, or on an individual collector's performance. NACM, Enhancing Credit Department Performance with Comprehensive KPIs
Read ADD next to past-due percentage
ADD is most useful paired with past-due percentage:
Past-Due Percentage = Overdue Invoices ÷ Total Receivables × 100
DSO and Best Possible DSO are expressed in days. Past-due percentage is expressed as a share of the portfolio. Together they answer different halves of the same question: how much is late, and how late is it.
Aging data adds a third dimension — where in the cycle the past-due balance sits.
Where CEI fits in
Collection Effectiveness Index (CEI) is a fourth companion metric worth knowing:
DSO: how long is the full receivables position, in days Best Possible DSO: how long would it be if nothing were past due ADD: the days-based gap between the two CEI: what share of collectible receivables was actually collected, as a percentage
None of these four replaces the others. Each is a different lens on the same underlying receivables.
Before comparing ADD across periods
DSO and Best Possible DSO can each be calculated with different conventions (period-based vs. average-balance, annualized vs. not). Before comparing ADD month over month, confirm:
- Same reporting period and day count
- Same credit-sales basis
- Same DSO methodology used for both the DSO and Best Possible DSO inputs
- Same current vs. past-due definitions
Mixing methodologies between periods will move ADD without any real change in collections.
The practical takeaway
DSO tells you how long receivables are open. Best Possible DSO tells you what that number would look like with zero delinquency. ADD is the gap between them, in days.
Read alongside past-due percentage, aging, and CEI, ADD turns "our DSO went up" into a more specific starting point: how much of that increase is delinquency, and which accounts are driving it.
That's the question collections teams should actually be chasing, not the headline DSO number on its own.
Sources
National Association of Credit Management, Quick Formulas
National Association of Credit Management, DSO: Friend or Foe